
- The Nasdaq continues to confound the naysayers, but it’s metronomic rise is par for the bull market course if you’re a trend follower.
- The uranium is pulling back after its strong rally, raising some questions over whether its new bull market is sustainable.
- Copper prices have surged over the last week to confirm their own bull run, we investigate the key trends and key levels that may impact its near term performance.
In today’s edition of ChartWatch Markets, we’ll be covering the technicals for:
-
Nasdaq Composite
-
Uranium Futures (Front month, back-adjusted) COMEX
-
High Grade Copper Futures (Front month, back-adjusted) COMEX
-
Copper – LME Official Cash
Nasdaq Composite Index
 An interesting chart (click here for full size image)
As far as the 3 tent pegs of my technical model go, i.e., trends, price action and candles:
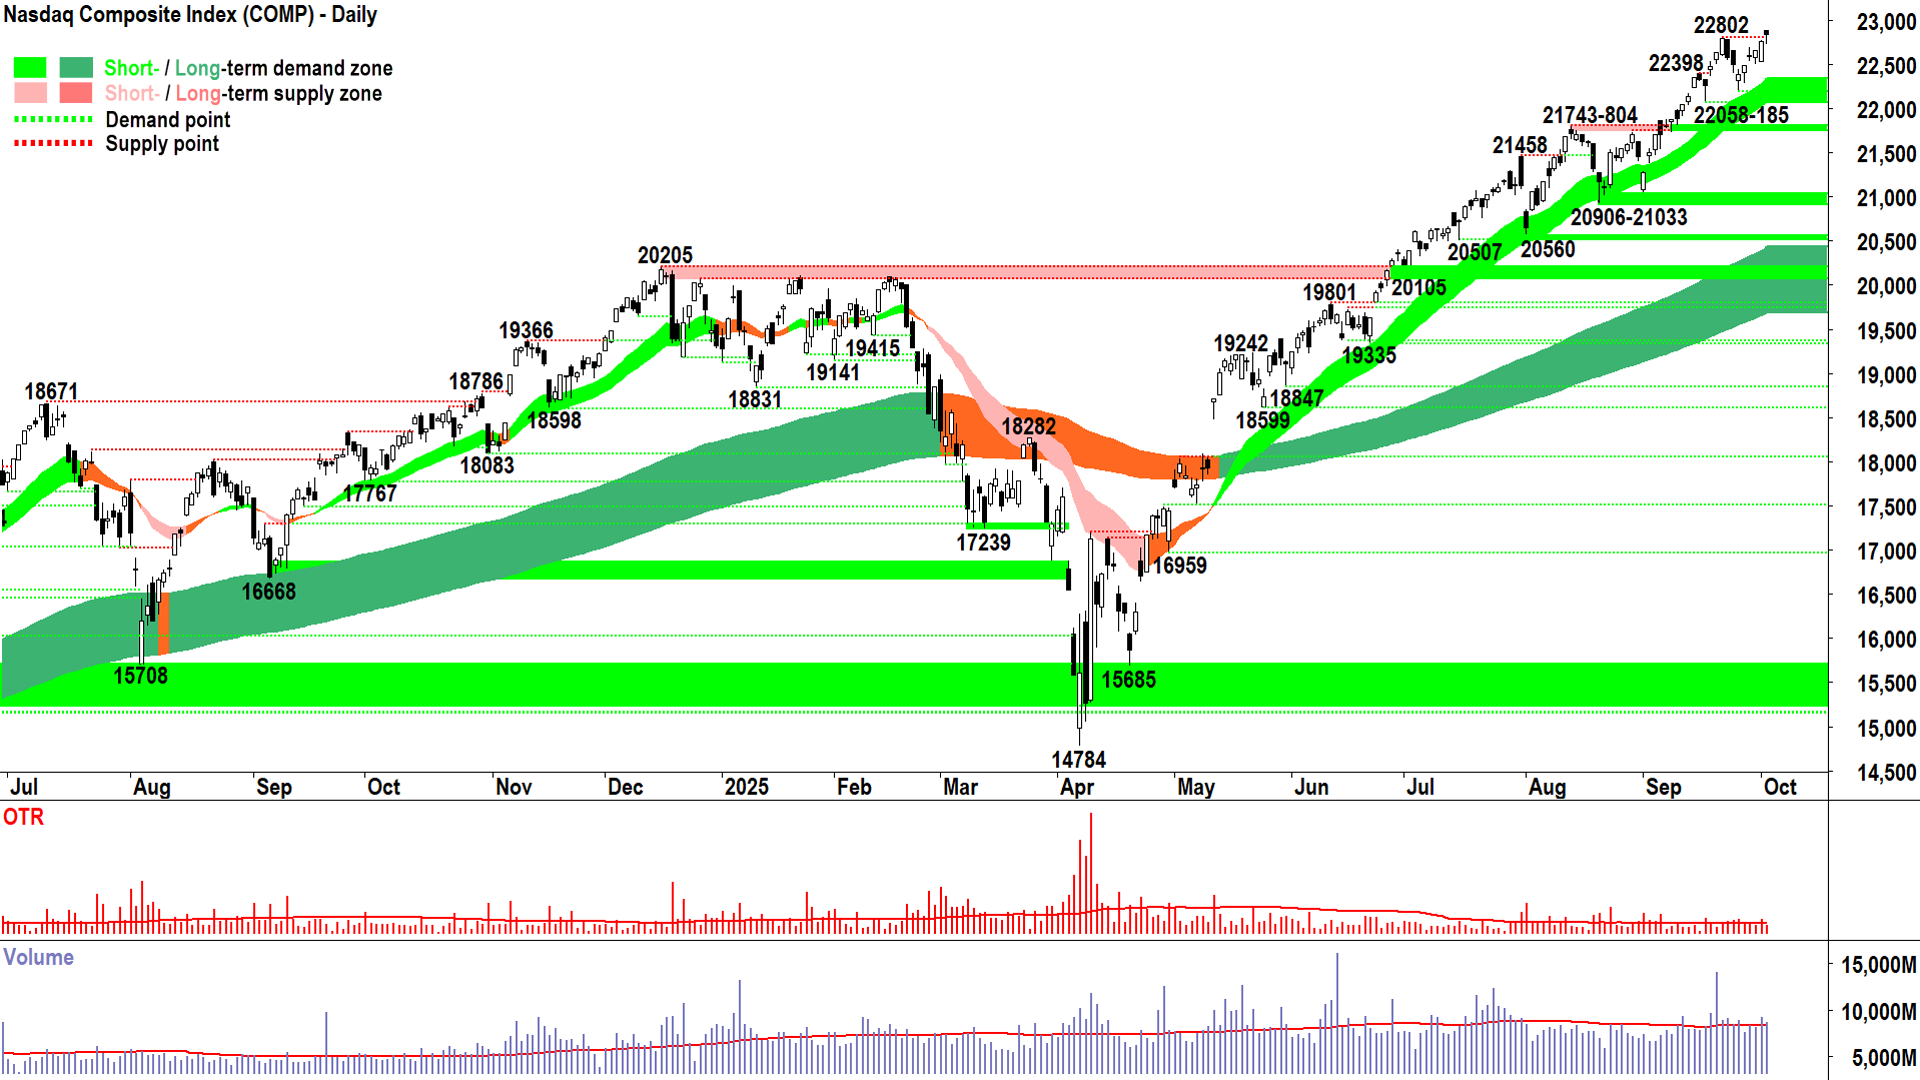
A small demand-side candle on average volume. Thursday’s candle is par for this bull market course. The Comp is almost so metronomic it’s becoming… predictable! 🧐
Just like I said yesterday, daily demand-side showings in a bull market are anything but boring – they’re beloved by us trend followers – but please don’t go to that next step and expect them to occur! This is downright dangerous! ⚠️
We’re trend followers remember? We are not trend prognosticators.
There’s an important difference. As trend followers, we respect the fact that we’re price takers – we don’t control the demand-supply environment – we merely interpret from the trends, price action, and candles, what’s likely happening in it – and then we allocate our risk accordingly.
What happens, happens. We’ll deal with it when it does. We are reactive.
Prognosticators like to feel that they can somehow foresee what will happen down the road. They think they’re a bit smarter than everyone else – well smarter than us trend followers, anyway!
Hey – but don’t we allocate our risk based on the trend continuing more often than not (“MOTN”). Isn’t that a form of prognostication too? 🤔
I argue it’s not. We’re not expecting an outcome. For us it’s simply stimulus vs response kind of stuff… Stimulus = Uptrend vs Response = Allocate risk. If we the outcome goes our way, then great, but if it doesn’t – then we fully accept this, manage our risk, and move on.
The prognosticator expects an outcome. They can become quite committed to it – probably backing it up in their minds with all nature of credible supporting narratives (“credible supporting narratives” are 100% the most dangerous thing to your investing – but that’s a topic for another day!).
The problem with prognostication, is that one tends to be surprised or even disappointed when one’s prognoses don’t come to fruition. Surprise and disappointment can often lead to an emotional response, and we all know that we don’t make good decisions about our money (risk!) when we’re emotional 👎.
So, by being trend followers, by totally accepting we have no possible way of predicting or effecting the outcome – when the outcome doesn’t go our way, we’re more likely to accept it and move on. It’s just an outcome. Either it went our way, or it didn’t. Hey, it’s not like we had an opinion in the first place, so there’s no dent to our ego… Just get on with the business of managing risk and identifying the next strong trend.
I used to prognosticate, a long time ago before I became a trend follower. I used to think I was smarter than the market, and that I could predict outcomes. When I was right (now I know those times were pure coincidence and not incredible intelligence and foresight) I would pat myself on the back and say: “See, I was right, I am a genius, and mum was right – I am special!”
When I was wrong – well I was never wrong – the stupid market full of stupid investors was wrong. So, no point discussing this item… But let me say how annoyed I was at how stupid everyone else was…
Get my drift? 😁
Firstly, that annoyed bit – it’s not good. It makes you do stupid things with your money… like holding on well after the trend has changed… chasing losses… or cutting winners too quickly out of fear they’d turn out like one’s frequent losers…
You know – all the opposite stuff to what I should have been doing!
Secondly, and this is what took me the longest to realise: Just as it was pure coincidence when my prognosis turned out to be right – it was also pure coincidence when my prognosis turned out to be wrong.
When you realise this bit, you lose that chip on your shoulder. It humbles you, and it helps you understand that if you can’t predict an outcome, let alone control it – then stop worrying about it – and stop stroking your ego/beating yourself up when a trade goes/doesn’t go your way.
Oops… It looks like I have once again drifted off… Sorry! I better do some technical analysis now! As far as the 3 tent pegs of my technical model go versus the Comp, i.e., trends, price action and candles:
-
Short and long term trend ribbons: ⬆️/⬆️, widening/getting stronger, both acting as zones of dynamic excess demand, i.e., accumulation + buy the dip = Consistent with demand-side control ✅
-
Price action: Rising peaks and rising troughs 📈, i.e., supply removal and demand reinforcement + buy the dip = Consistent with demand-side control ✅
-
Candles: White-bodied candles and or downward pointing shadows i.e., pervasive programmed buy orders + buy the dip = Consistent with demand-side control ✅
Conclusion: ✅✅✅ = I prefer to stay the course here at FRP (Full Risk Position = My personal allowable capital allocation limit for my investments in US stocks is 100%)
Key levels: 22058 is the closest point of demand, the price should not close below here if the demand-side is in control of the Comp’s price; a close below the short term uptrend ribbon (presently 22070-22340) will nullify the short term uptrend = ⚠️
Uranium Futures (Front month, back-adjusted) COMEX
 An interesting chart (click here for full size image)
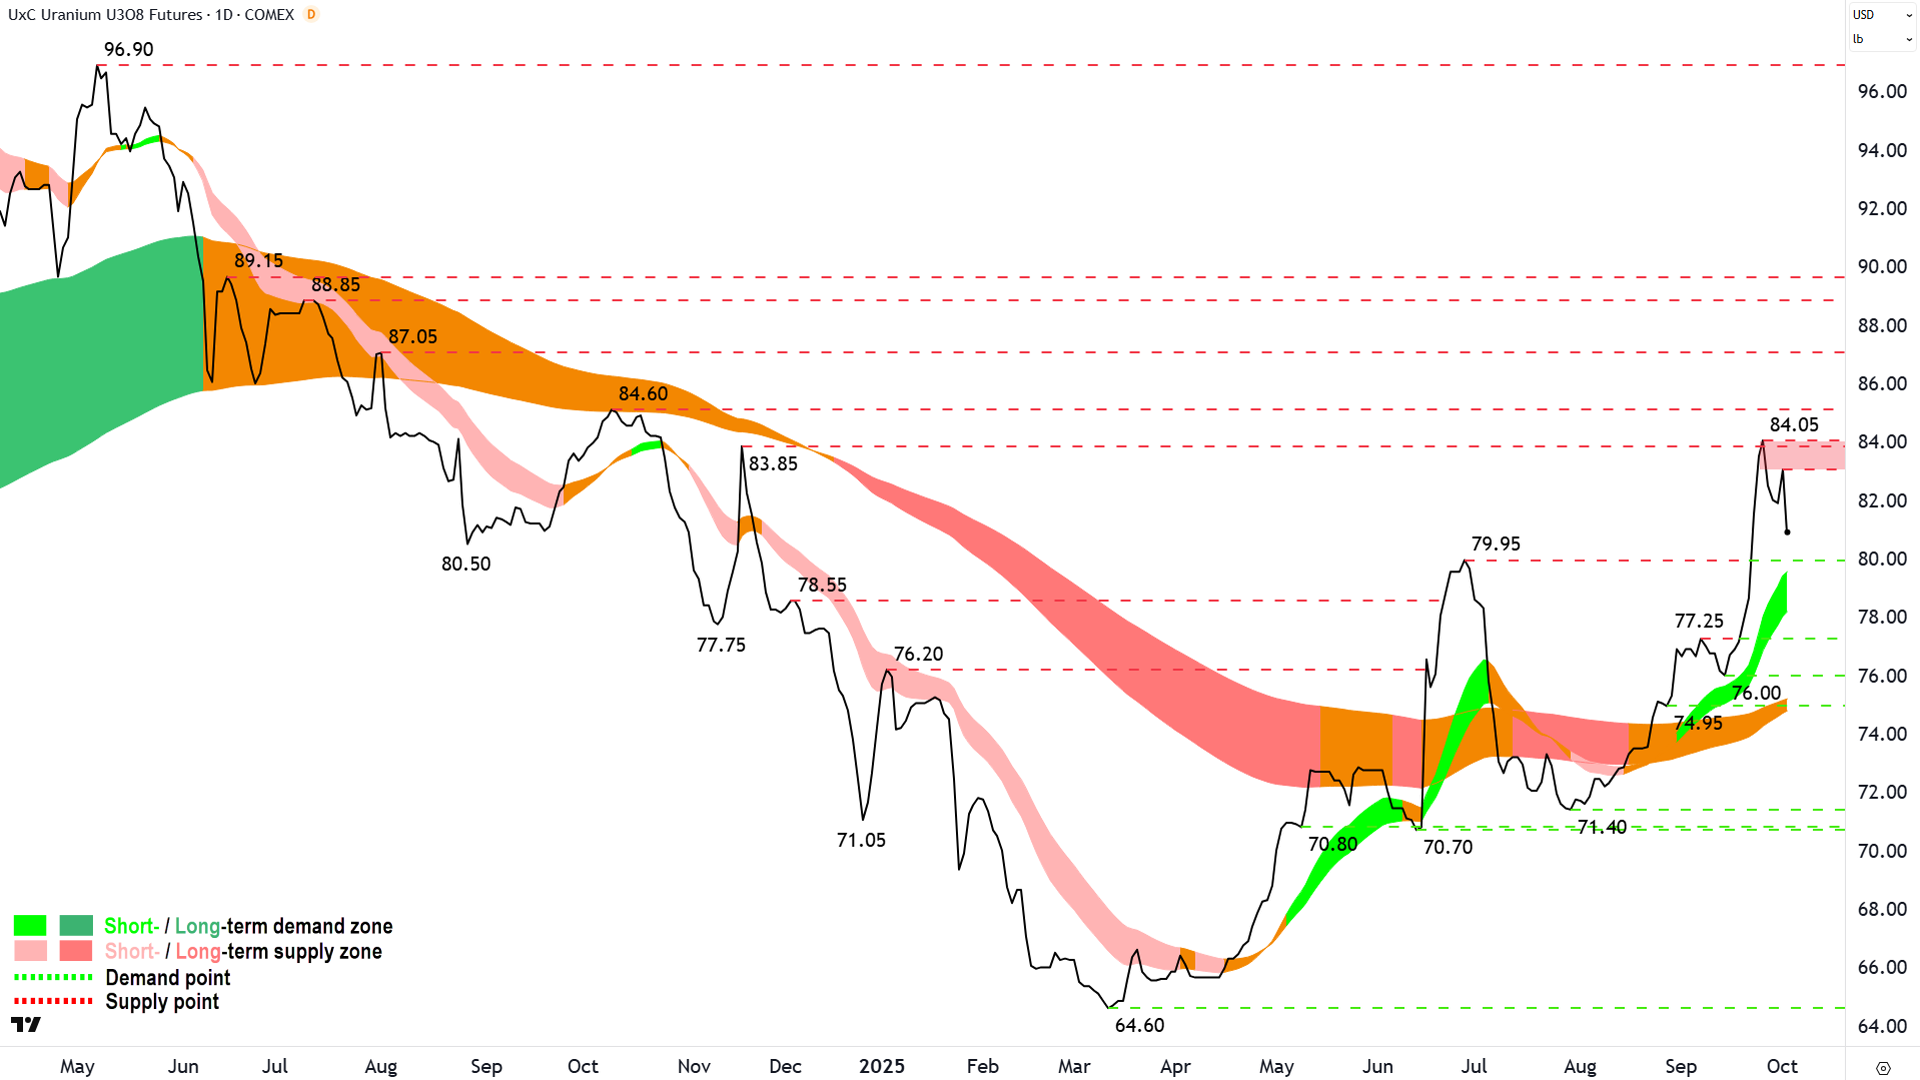
It’s been a couple of weeks since I made the tentative call that uranium’s long term trend had switched from neutral to up – effectively my definition of a “bull market”. In last week’s update, I removed the word “tentative” as I noted the consumption of the 79.95 major point of supply.
As they say in the classics: Nothing goes up in a straight line, and we are seeing the uranium price pullback from a well-defined zone of supply at 83.85-84.60.
Remember, zones of supply are only suspected until we see the price action there. We don’t have the benefit of candles on uranium, so that means we must look to the price action. In this case, the price action from 83.85-84.60 is now falling peaks (84.05 > 83.05) and falling troughs (81.90 > wherever the next trough forms!).
It’s a zone of excess supply alright ✅.
Which is not a bad thing, there’s always supply in the system – but in a bona fide bull market there’s also more demand around and that demand tends to consume it.
We’re now looking for where that demand might kick in again. The old major point of supply at 79.95 is a logical place where this might occur – but again – we must see the price action there first to confirm.
So that’s what we’re looking for now. Note that the short term uptrend ribbon is going to catch up to roughly coincide with that key 79.95 level, thereby adding a degree of dynamic demand support.
Conclusion: Put simply, the short term trend remains intact and the long term uptrend is still developing. Therefore, I’m happy to stay the course here for now… but I’m watching closely 🧐!
Key levels: 79.95 is the closest point of demand, the price should not close below here if the demand-side is in control of uranium’s price; a close below the short term uptrend ribbon (presently 78.20-79.60) will nullify the short term uptrend = ⚠️
High Grade Copper Futures (Front month, back-adjusted) COMEX
 An interesting chart (click here for full size image)
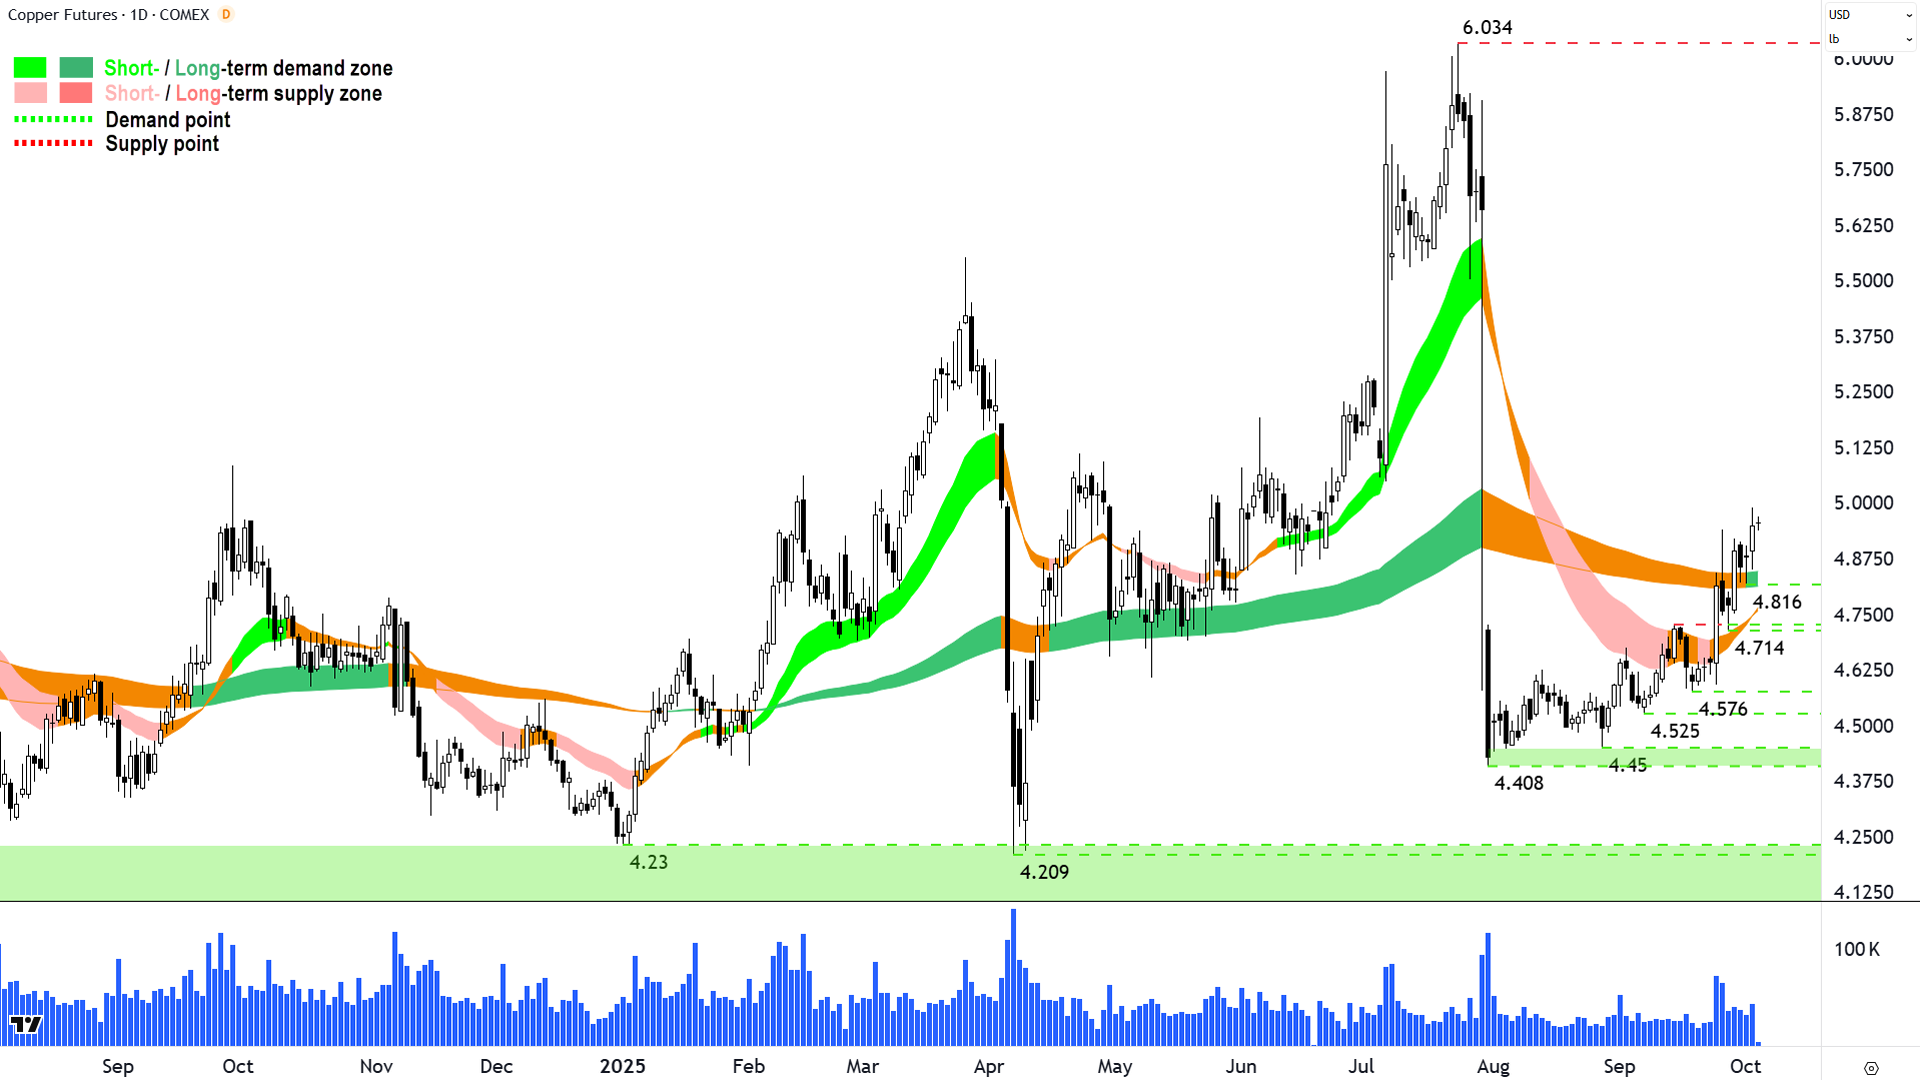
In our last update on copper we noted improving trends on the LME contract, but a high grade contract that was making only gradual headway in terms of recouping the massive losses it suffered after U.S. tariff news disappointed traders back in August.
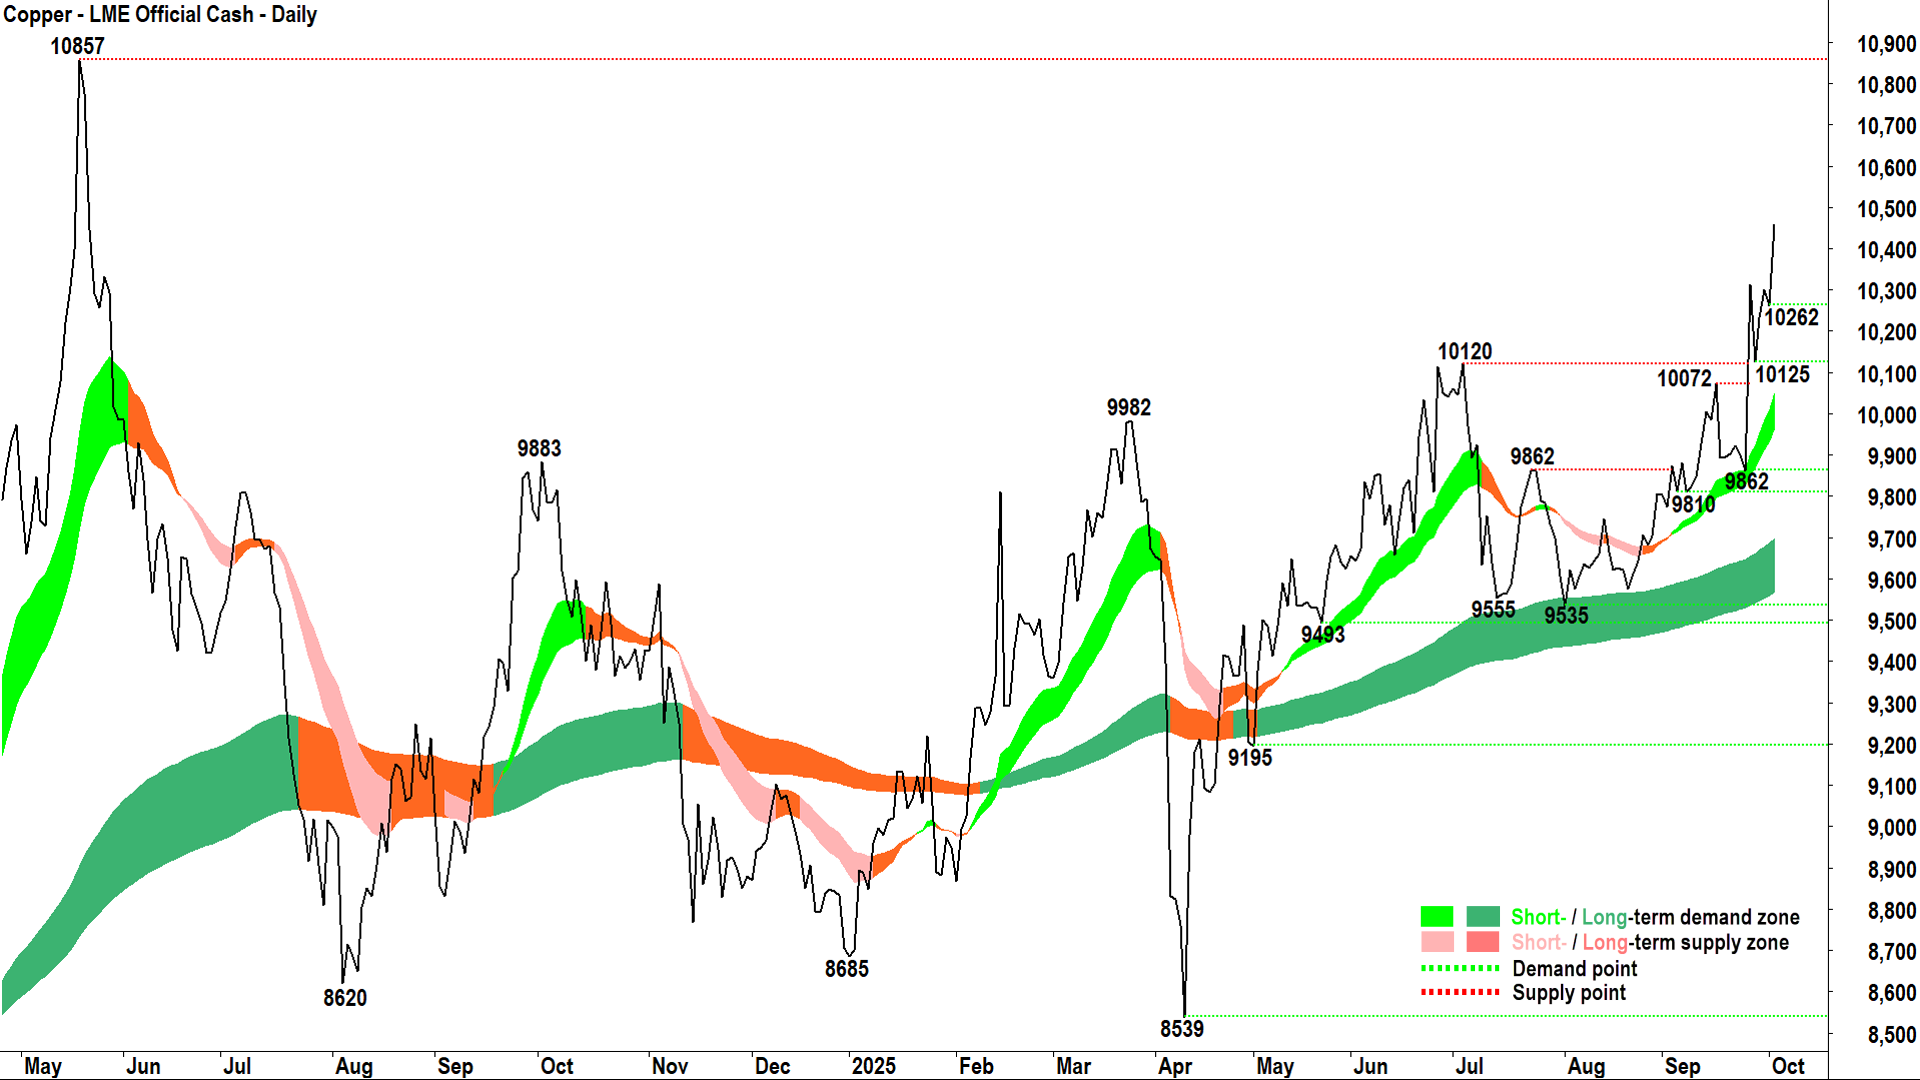
Good news on both fronts, LME copper has logged a solid rally to take out the key psychological 10,000 mark, and high grade copper has been equally busy to the upside, reclaiming the long term uptrend ribbon.
On that last item, I note that the long term uptrend has transitioned back to uptrend (dark green) and it now appears to be acting as a zone of dynamic demand. When we combine shorter term aspects such as a short term uptrend ribbon that’s also just crossed back up, rising peaks and rising troughs in the price action, and a return to a predominance of demand-side candles – I think we can now say that the weight of evidence points to the demand-side having regained control of copper’s price.
There are few obvious points of supply to contend with because the post-tariff announcement move was so severe. This is actually a good thing, as there are few points where traders got caught up on the way down… so they’re less likely then to peg these as places to create excess supply on the way back up.
As a result of the improvement in the technicals here since our last update, I’m happy to move to a more risk seeking stance on high grade copper. This view is substantially supported by the strong technicals in the LME copper chart below.
 Copper – LME Official Cash (click here for full size image)
This chart offers far clearer evidence of demand-side control: strong and accelerating short and long term uptrend, rising peaks and rising troughs in the price action, and with that price action steepening sharply since our last check-up. It suggests the demand-side is growing more motivated, and the supply-side is growing far less engaged.
Conclusion: Happy to stay the course here.
Key levels: 10857 is the key point of supplyfor LME copper, I would be watchful for signs of excess supply up there. 10072-10120 is the closest zone of demand. the price should not close below here if the demand-side is in control of LME copper’s price; a close below the short term uptrend ribbon (presently 9965-10055) will nullify the short term uptrend = ⚠️
ChartWatch *LIVE* Webinar
ChartWatch *LIVE* Webinars are back and they’re coming to Wednesday lunchtimes WEEKLY 💪
Learn more about technical analysis and trend following through real case studies on ASX stocks. Australia’s premier technical analyst, Carl Capolingua, shares his unique insights on stocks as requested by viewers. Ask about a company in your portfolio or anything related to trading and investing and get Carl’s seasoned specialist perspective.
Places are limited so >REGISTER NOW!<
Want free investment tools and ASX research?
Market Index provides investors with access to:
- Broker consensus
- ASX announcement data
- Dividend information
And a whole lot more… Click here to access everything 100% free at Market Index